Use Azure Storage Logs to analyse Synapse Analytics Serverless SQL Pools Activity
This blog is marked as intermediate knowledge as an understanding of Serverless SQL Pools is preferable, but not essential. Refer to Getting Started with Serverless SQL Pools to understand the service and how to setup a Serverless database.
Overview
When working with Serverless SQL Pools and data stored in Azure Storage, it’s useful to analyse the activity on the storage account to ensure activity is as expected. For example, when using any partitioning functions in Serverless SQL Pools like the filepath function, or querying partitioned Delta data, the Azure Storage logs will show the folders and files being scanned. You can then see whether any SQL queries using partitioning are only scanning the required folders and files. This is important to ensure data processed remains as low as possible (as this is how you are being billed).
In this blog we’ll walk through setting up Azure Storage logs in Azure Monitor and generate query activity using Serverless SQL Pools. We’ll then use Serverless SQL Pools to analyse the logs generated using T-SQL.
In a future blog post we’ll look at setting up Log Analytics and querying Azure Storage activity using KQL (Kusto Querying Language).
The SQL code in this example is available in the serverlesssqlpooltools GitHub repo here.
Serverless SQL Pools Data Processed
We can see how much data is being processed when running a SQL query over Data Lake data using the Monitor area in Synapse Studio. This is very useful to check the amount of data each SQL query is processing and the total cost associated with each query. This also helps in troubleshooting performance and in pointing out any unoptimised workloads.
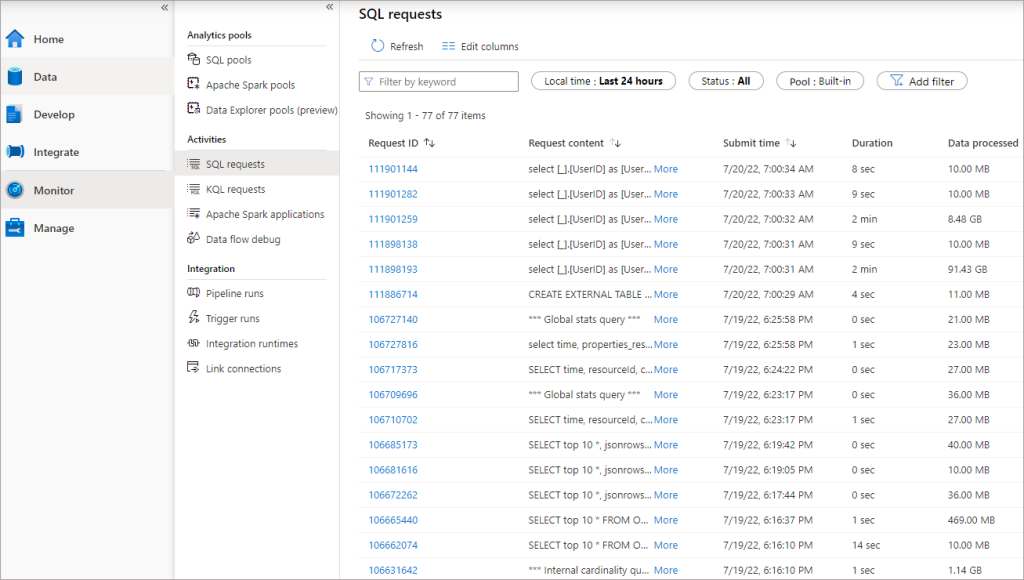
However, we can get more fine-grained telemetry by analysing the storage logs, this will actually show us the folders and files in the data lake being processed by Serverless SQL Pools.
Pricing
There is a cost associated with setting up logging, currently to save logs to a storage account is £0.256 per GB for the processing itself (pricing here), plus the storage account costs (pricing here), e.g. £0.0156 per GB for standard, hot storage.
Setting up Azure Storage Logging
We’ll now walk-through creating a storage account to hold the logs, setting up logging on an Azure Data Lake Gen2 account (we cannot log to the same storage account we’re monitoring), generating activity by running SQL queries in Serverless SQL Pools, and then analysing the logs.
Setting up a General Purpose Storage Account
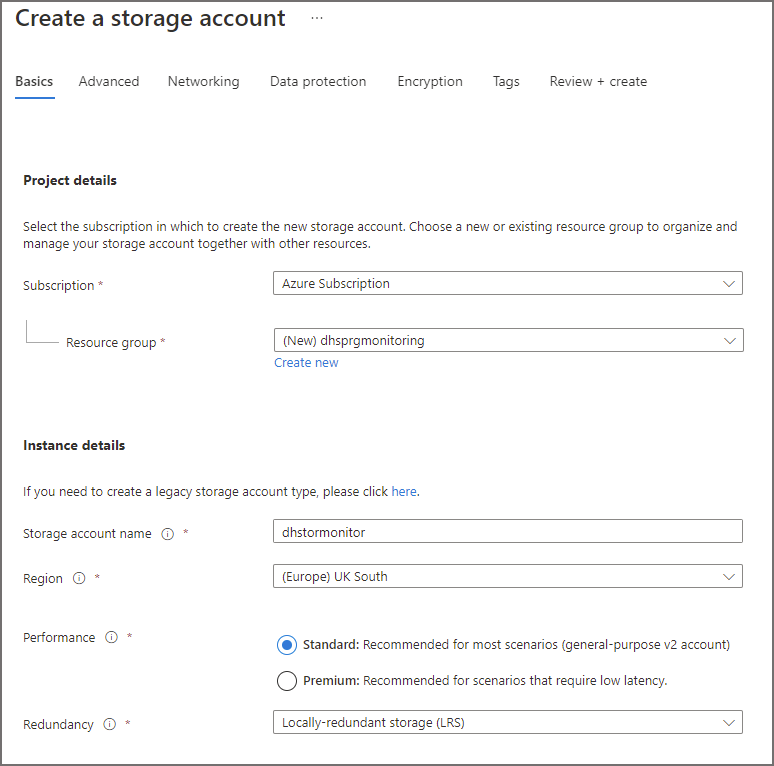
To save logs, we need to create a general purpose v2 storage account. In the following example, a new Azure Storage account has been setup with standard performance and locally-redundant storage. In the Advanced tab, the Enable hierarchical namespace has not been enabled. All other settings have been left as default.
Setting up Storage Read Logging
After setting up the general purpose v2 account, we can now configure an Azure Data Lake Gen2 account to log activity to this account. In the following example we will configure an account that has data stored which Serverless SQL Pools has access to query.
In the Azure portal, browse to the relevant Azure Data Lake Gen2 account. Click on Diagnostics settings in the Monitoring section in the left menu.
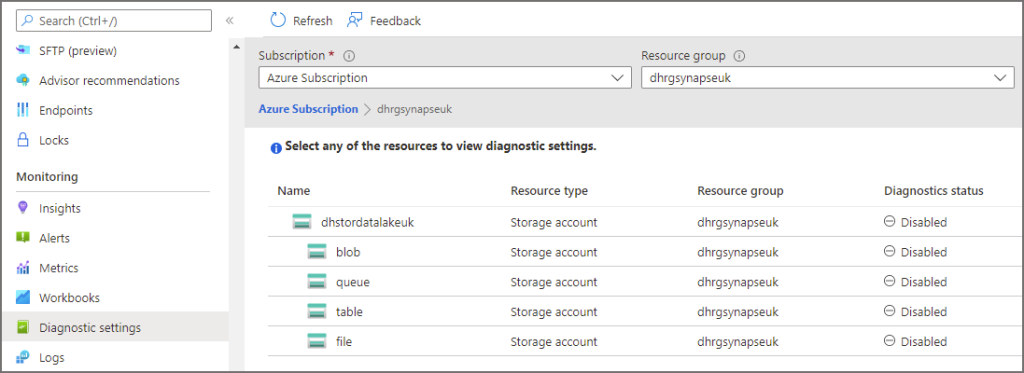
Click on blob under the storage account name in the tree list and then click Add Diagnostic Setting.
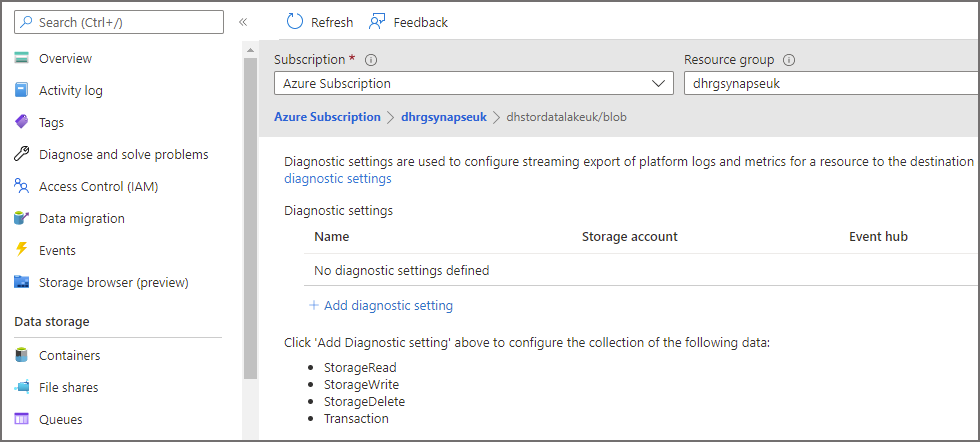
Enter the following information in the diagnostics window.
- Enter a name for the diagnostic setting
- Enable StorageRead under Logs Categories (you can also enable StorageWrite if writing data back to the Data Lake using Serverless SQL Pools)
- Select Archive to a storage account and select the general purpose storage account created in the step earlier
- Click Save
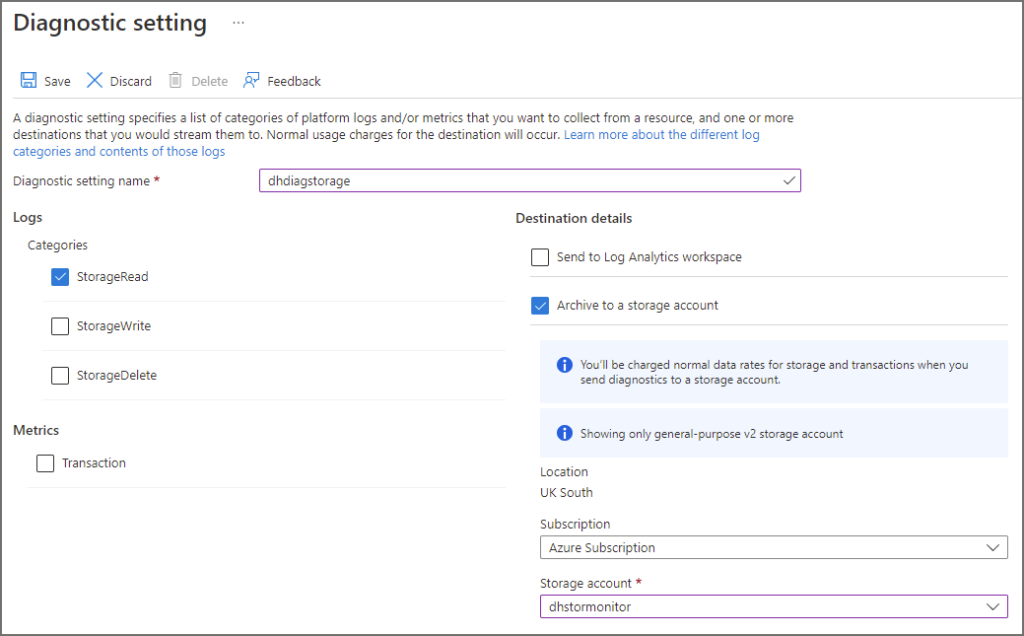
Now that we’ve configured the Azure Data Lake Gen2 account for logging and read activity, we can now generate activity using Serverless SQL Pools queries and see the results in the logs.
Run Queries in Serverless SQL Pools
We’ll now create a View in a Serverless SQL Pools database which includes 3 columns that use the filepath function (more info here) , we can use these columns to partition prune and only process data in folders we specify in the WHERE clause. The logs should show folders that have been queried when a SQL query by Serverless is issued.
The dataset used is ~1billion rows of Web Telemetry data from 09/2021 to 12/2021.
Create View
In the following View definition the OPENROWSET command is pointed toward Web Telemetry event data stored as Parquet file format in a folder partition format \EventYear=YYYY\EventMonth=MM\EventDate=YYYY-MM-DD\. The * wildcards in the BULK statement will be returned as the FolderEventYear, FolderEventMonth, and FolderEventDate columns in the view, allowing the use of filters in the WHERE clause. Please note that there are 3 other date fields, EventYear, EventMonth, and EventDate – these columns are actual data stored in the source Parquet files. We’ll use these columns to illustrate the difference when filtering data using the filepath columns and using columns within the Parquet files themselves..
A Serverless SQL Pools database has already been created and a data source added to point towards the Azure Data Lake Gen2.
--create a view over data lake data
CREATE VIEW LDW.vwWebTelemetryParquet
AS
SELECT
    UserID,
    EventType,
    ProductID,
    [URL] AS ProductURL,
    Device,
    SessionViewSeconds,
    FilePathYear AS EventYear,
    FilePathMonth AS EventMonth,
    FilePathDate AS EventDate,
    CAST(fct.filepath(1) AS SMALLINT) AS FolderEventYear,
    CAST(fct.filepath(2) AS TINYINT) AS FolderEventMonth,
    CAST(fct.filepath(3) AS DATE) AS FolderEventDate
FROM
 OPENROWSET
(
    BULK 'cleansed/webtelemetry/EventYear=*/EventMonth=*/EventDate=*/*.parquet',
    DATA_SOURCE = 'ExternalDataSourceDataLakeMI',
    FORMAT = 'Parquet'
)
WITH
(
    UserID INT,
    EventType VARCHAR(50),
    EventDateTime DATE,
    ProductID SMALLINT,
    URL VARCHAR(50),
    Device VARCHAR(10),
    SessionViewSeconds INT,
    FilePathYear SMALLINT,
    FilePathMonth TINYINT,
    FilePathDate DATE
) AS fct;
Now that a view has been created, we can start running queries. We’ll run 3 queries and then analyse the logs afterward.
Query 1: Run Query with No Partition Pruning
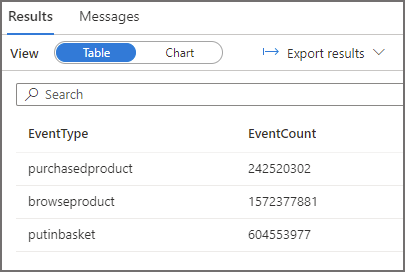
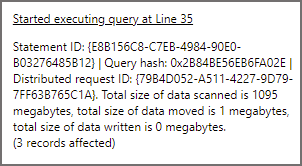
This query will aggregate events by the event type column, it has no filter so we expect all data in the cleansed/webtelemetry folder to be read. The result statistics image below shows 1095MB scanned.
--select all data
SELECT
    EventType,
    COUNT(*) AS EventCount
FROM LDW.vwWebTelemetryParquet
GROUP BY
    EventType
Query 2: Run Query with Partition Pruning
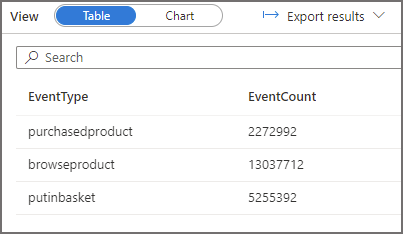
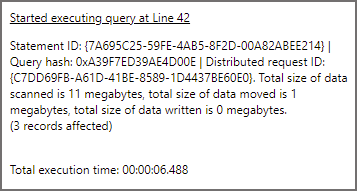
We’ll now run a query where we select data and use a column, FolderEventDate, that is the result of the filepath function, in the WHERE clause to only read data from the 2021-12-02 folder. In the logs we should see Serverless SQL Pools has scanned only 1 of the folders. The result statistics image below shows 11MB scanned.
--filter using the filepath column FolderEventDate
SELECT
    EventType,
    COUNT(*) AS EventCount
FROM LDW.vwWebTelemetryParquet
WHERE FolderEventDate = '2021-10-02'
GROUP BY
    EventType
Query 3: Run Query with Filter but no Partition Pruning
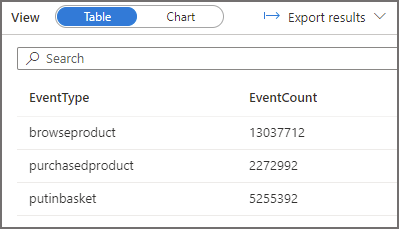
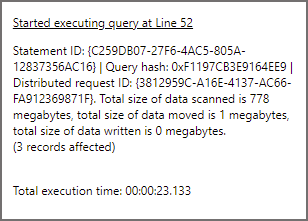
This query is going to filter the data and provide the same results as above except we’re not using the FolderEventDate (filepath function) column , we’re using a column in the parquet data itself. When we run this query, it will need to scan all the folders before returning the same dataset. In the logs we should see Serverless SQL Pools has scanned all the folders. The result statistics image below shows 778MB scanned.
SELECT
    EventType,
    COUNT(*) AS EventCount
FROM LDW.vwWebTelemetryParquet
WHERE EventDate = '2021-10-02'
GROUP BY
    EventType
Analysing Log Files
Once we have run the 3 SQL queries above, we can now analyse the logs captured in the general purpose storage account. The logs are stored in a container called insights-logs-storageread, then a folder structure similar to this example /resourceId=/subscriptions//resourceGroups/dhrgsynapseuk/ and has partitions for Year, Month, Day, Hour, and Minute. The following image shows a JSON log file at the root of the date folders. Please note the storage account has been added to the Synapse workspace as a linked service.

JSON Schema in Log Files
We can download and open a log file in any text editor and see the JSON, each request logged is a line-separated JSON message. Certain attributes will appear in certain circumstances, for example the request below came from a Serverless SQL Pools request using Managed Identity as the security model to query the data lake. We can use attributes such as delegatedResource to filter only on logs where the source system is Synapse.
{
   "time":"2022-07-20T06:00:42.4059174Z",
   "resourceId":"/subscriptions/d496ab56/resourceGroups/dhrgsynapseuk/providers/Microsoft.Storage/storageAccounts/dhstordatalakeuk/blobServices/default",
   "category":"StorageRead",
   "operationName":"ReadFile",
   "operationVersion":"2018-06-17",
   "schemaVersion":"1.0",
   "statusCode":206,
   "statusText":"Success",
   "durationMs":153,
   "callerIpAddress":"10.0.0.15",
   "correlationId":"a5a84413-501f-0033-30fe-9ba79b000000",
   "identity":{
      "type":"OAuth",
      "tokenHash":"AA5DB00B973961BF47573EBA5699BA754294C74B7DC8756FFA5D90F3EB00409E",
      "authorization":[
         {
            "action":"Microsoft.Storage/storageAccounts/blobServices/containers/blobs/read",
            "roleAssignmentId":"7d0c900a",
            "roleDefinitionId":"ba92f5b4",
            "principals":[
               {
                  "id":"60317038",
                  "type":"ServicePrincipal"
               }
            ],
            "denyAssignmentId":""
         }
      ],
      "requester":{
         "appId":"04b6f050",
         "audience":"https://storage.azure.com/",
         "objectId":"60317038",
         "tenantId":"6ec2ccb9",
         "tokenIssuer":"https://sts.windows.net/6ec2ccb9/"
      },
      "delegatedResource":{
         "resourceId":"/subscriptions/dfdsfds/resourcegroups/dhrgsynapseuk/providers/Microsoft.Synapse/workspaces/dhsynapseuk",
         "objectId":"/subscriptions/dfdsfds/resourcegroups/dhrgsynapseuk/providers/Microsoft.Synapse/workspaces/dhsynapseuk",
         "tenantId":"45ef4t4"
      }
   },
   "location":"UK South",
   "properties":{
      "accountName":"dhstordatalakeuk",
      "userAgentHeader":"SQLBLOBACCESS",
      "serviceType":"blob",
      "objectKey":"/dhstordatalakeuk/datalakehouseuk/curated/webtelemetry/EventYear=2022/EventMonth=2/EventDate=2022-02-24/part-00023-52ae6d7c-a056-4827-8109-e4e1bb2782e6.c000.snappy.parquet",
      "lastModifiedTime":"2022/04/07 10:22:24.1726814",
      "conditionsUsed":"If-Match=\"0x8DA188081F7C95E\"",
      "metricResponseType":"Success",
      "serverLatencyMs":41,
      "requestHeaderSize":1863,
      "responseHeaderSize":398,
      "responseBodySize":2097152,
      "tlsVersion":"TLS 1.2",
      "downloadRange":"bytes=41975061-44072212"
   },
   "uri":"https://dhstordatalakeuk.dfs.core.windows.net/datalakehouseuk/curated/webtelemetry/EventYear=2022/EventMonth=2/EventDate=2022-02-24/part-00023-52ae6d7c-a056-4827-8109-e4e1bb2782e6.c000.snappy.parquet",
   "protocol":"HTTPS",
   "resourceType":"Microsoft.Storage/storageAccounts/blobServices"
}
View Logs in Serverless SQL Pools
Let’s use Serverless SQL Pools to actually query the log file as it supports querying JSON structures. The storage account has been added as a linked service to the Synapse workspace and we can then create a View in a Serverless SQL Pools database with the log path in the OPENROWSET command. Wildcards have also been added to the date partitioned folders /y=*/m=*/d=*/h=*/m=*/ in the BULK statement to allow use of the filepath function to filter only on specific time periods. 8 columns have been added to the view to allow folder filtering.
The SQL code in this example is available in the serverlesssqlpooltools GitHub repo here.
00create and configure new Serverless SQL Pools database
CREATE DATABASE LogAnalysis

USE LogAnalysis

--encryption to allow authentication
CREATE MASTER KEY ENCRYPTION BY PASSWORD = 'dsfads$%zdsfkjsdhlk456hvwegf';

--ensure Synapse workspace has been added as a Storage Blob Data Reader to general purpose storage account
CREATE DATABASE SCOPED CREDENTIAL DataLakeManagedIdentity
WITH IDENTITY='Managed Identity'

--create data source to general purpose storage account
--replace <storage-account> with relevant value
CREATE EXTERNAL DATA SOURCE ExternalDataSourceDataLakeMI
	WITH (
		LOCATION   = 'https://<storage-account>.blob.core.windows.net/insights-logs-storageread',
        CREDENTIAL = DataLakeManagedIdentity
	    );

--enable support for UTF8
ALTER DATABASE LogAnalysis COLLATE Latin1_General_100_BIN2_UTF8;

--create View over the storage logs
CREATE OR ALTER VIEW dbo.vwAnalyseLogs
AS
SELECT
    time,
    resourceId,
    category,
    operationName,
    operationVersion,
    schemaVersion,
    statusCode,
    statusText,
    durationMs,
    callerIpAddress,
    correlationId,
    identity_type,
    identity_tokenHash,
    [location],
    identity_delegatedResource_resourceId,
    properties_accountName,
    properties_serviceType,
    properties_objectKey,
    properties_metricResponseType,
    properties_serverLatencyMs,
    properties_requestHeaderSize,
    properties_responseHeaderSize,
    properties_responseBodySize,
    properties_tlsVersion,
    uri,
    protocol,
    resourceType,
    jsonrows.filepath(1) as SubscriptionID,
    jsonrows.filepath(2) as ResourceGroup,
    jsonrows.filepath(3) as StorageAccount,
    jsonrows.filepath(4) as LogYear,
    jsonrows.filepath(5) as LogMonth,
    jsonrows.filepath(6) as LogDay,
    jsonrows.filepath(7) as LogHour,
    jsonrows.filepath(8) as LogMinute
FROM OPENROWSET
    (
        BULK '/resourceId=/subscriptions/*/resourceGroups/*/providers/Microsoft.Storage/storageAccounts/*/blobServices/default/y=*/m=*/d=*/h=*/m=*/*',
        DATA_SOURCE = 'ExternalDataSourceDataLakeMI',
        FORMAT = 'CSV',
        PARSER_VERSION = '2.0',
        FIELDTERMINATOR = '0x09',
        FIELDQUOTE = '0x0b',
        ROWTERMINATOR = '0x0A'
    ) WITH (doc NVARCHAR(4000)) AS jsonrows
    CROSS APPLY OPENJSON (doc)
        WITH (  time DATETIME2 '$.time',
                resourceId VARCHAR(500) '$.resourceId',
                category VARCHAR(50) '$.category',
                operationName VARCHAR(100) '$.operationName',
                operationVersion VARCHAR(10) '$.operationVersion',
                schemaVersion VARCHAR(10) '$.schemaVersion',
                statusCode SMALLINT '$.statusCode',
                statusText VARCHAR(100) '$.statusText',
                durationMs INT '$.durationMs',
                callerIpAddress VARCHAR(50) '$.callerIpAddress',
                correlationId VARCHAR(50) '$.correlationId',
                identity_type VARCHAR(100) '$.identity.type',
                identity_tokenHash VARCHAR(100) '$.identity.tokenHash',
                [location] VARCHAR(50) '$.location',
                identity_delegatedResource_resourceId VARCHAR(500) '$.identity.delegatedResource.resourceId',
                properties_accountName VARCHAR(50) '$.properties.accountName',
                properties_serviceType VARCHAR(30) '$.properties.serviceType',
                properties_objectKey VARCHAR(250) '$.properties.objectKey',
                properties_metricResponseType VARCHAR(50) '$.properties.metricResponseType',
                properties_serverLatencyMs INT '$.properties.serverLatencyMs',
                properties_requestHeaderSize INT '$.properties.requestHeaderSize',
                properties_responseHeaderSize INT '$.properties.responseHeaderSize',
                properties_responseBodySize INT '$.properties.responseBodySize',
                properties_tlsVersion VARCHAR(10) '$.properties.tlsVersion',
                uri VARCHAR(500) '$.uri',
                protocol VARCHAR(50) '$.protocol',
                resourceType VARCHAR(250) '$.resourceType'
                )
We can now run SQL queries on the logs to view results. The following 2 queries below select aggregate activity on the EventMonth and EventDate column from the source data. You can also use the time column within the JSON data itself to pinpoint more accurately.
--aggregate by the source EventMonth and show how many unique files were scanned
SELECT
    statusText,
    CAST(REPLACE(SUBSTRING(uri,PATINDEX('%EventMonth=%',uri)+11,2),'/','') AS TINYINT) AS URIFolderMonth,
    COUNT(DISTINCT uri) AS FileScanCount
FROM dbo.vwAnalyseLogs
WHERE LogYear = 2022
AND LogMonth = '07'
AND LogDay = '20'
AND LogHour = '20'
AND operationName = 'ReadFile'
AND identity_delegatedResource_resourceId LIKE '%dhsynapsews%' --synapse workspace
GROUP BY
    statusText,
    CAST(REPLACE(SUBSTRING(uri,PATINDEX('%EventMonth=%',uri)+11,2),'/','') AS TINYINT)
ORDER BY 2

--aggregate by the source EventMonth and EventDate folder and show how many unique files were scanned
SELECT
    statusText,
    CAST(REPLACE(SUBSTRING(uri,PATINDEX('%EventMonth=%',uri)+11,2),'/','') AS TINYINT) AS URIFolderMonth,
    SUBSTRING(uri,PATINDEX('%EventDate=%',uri)+10,10) AS URIFolderDate,
    COUNT(DISTINCT uri) AS FileScanCount
FROM dbo.vwAnalyseLogs
WHERE LogYear = 2022
AND LogMonth = '07'
AND LogDay = '21'
AND LogHour = '12'
AND operationName = 'ReadFile'
AND identity_delegatedResource_resourceId LIKE '%dhsynapsews%'
GROUP BY
    statusText,
    CAST(REPLACE(SUBSTRING(uri,PATINDEX('%EventMonth=%',uri)+11,2),'/','') AS TINYINT),
    SUBSTRING(uri,PATINDEX('%EventDate=%',uri)+10,10)
ORDER BY 3
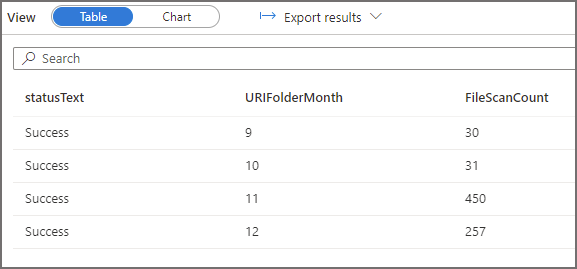
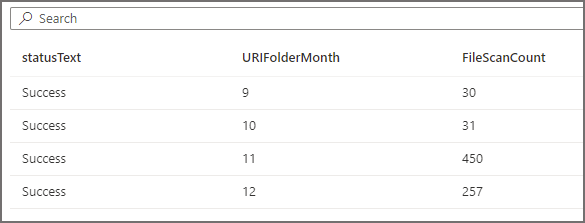
For the first query we ran earlier, we can see folders and files being scanned. The aggregate log queries shows that all the available month folders are being scanned (September to December 2021).
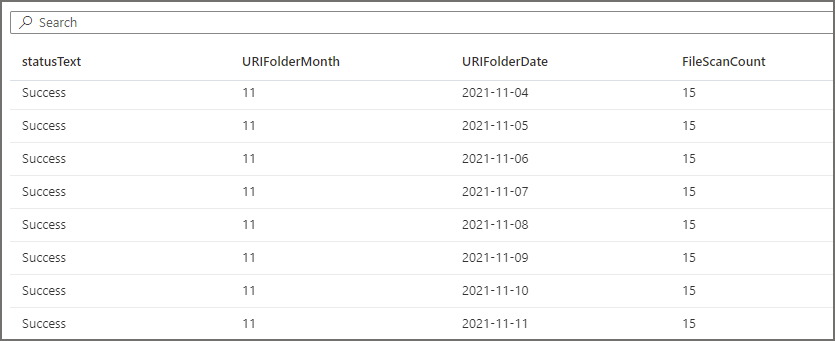
For the second query, if we run the same 2 SQL log statements above (with modified filters to select the appropriate logs) to see which folders have been scanned, we see that the EventMonth=10 folder was scanned. If we also query to see which EventDate folders were scanned, we see that only the EventDate=2021-10-02 folder was scanned. Serverless SQL Pools has successfully “partition pruned” the query when the filepath column was used in the WHERE clause.


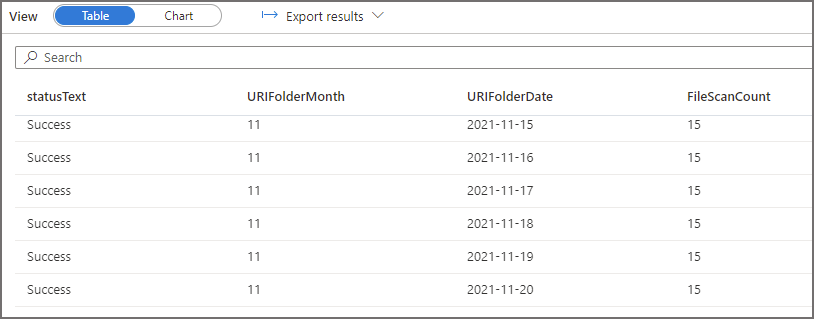
Lastly, if we analyse the logs for the third query in which we filtered the data but we used a column inside the parquet data itself and not a filepath column, we can see that all folders and files are scanned. This is because the column itself is in the parquet file and Serverless will need to scan all files to find the relevant values and return the results. This causes the amount of data processed to increase considerably, even though we’re getting the same results as the second query which used the filepath column to filter.
Conclusion
In this blog we have looked at how to setup logging using Azure Monitor to log activity between Serverless SQL Pools and Azure Data Lake Gen2. We then ran several queries to generate activity and then analysed that activity using Serverless SQL Pools itself to query the log files. In the next part of this series we’ll look at using Log Analytics to capture and view activity between Serverless SQL Pools and Azure Data Lake Gen2. Log Analytics would be preferable in an environment where multiple systems were being monitored for activity as this provides a central place to view logs.
We could also look at using the metrics contained within the logs to calculate reading size of the data and compare with Serverless SQL Pools monitoring, perhaps something for a future blog update.
References
- Monitoring Azure Blob Storage | Microsoft Docs
- Azure Blob Storage monitoring data reference | Microsoft Docs
- Query JSON files using serverless SQL pool – Azure Synapse Analytics | Microsoft Docs
- Storage Analytics logged operations and status messages (REST API) – Azure Storage | Microsoft Docs
- Storage Analytics log format (REST API) – Azure Storage | Microsoft Docs
- Pricing – Azure Monitor | Microsoft Azure
- Monitor – Microsoft Azure
- Query JSON files using serverless SQL pool – Azure Synapse Analytics | Microsoft Docs
- ASCII Chart & ISO 1252 Latin-1 Char Set | BarcodeFAQ.com
- JSON Formatter & Validator (curiousconcept.com)
- Pricing – Azure Monitor | Microsoft Azure




Great article Andy.
The question is: How can I correlate the serverless statement Id with storage log?