Fabric Warehouse Monitoring and Query Performance Analysis
Overview
Warehouse Monitoring and Query Performance Analysis? Yes…it’s important! You’ve spent time building a Data Warehouse & Analytical solution in Microsoft Fabric using the Warehouse service, you need to monitor it to ensure you’re getting the best value and it’s meeting SLAs in terms of loading and delivering data for reporting & analysis. This blog post dives into some key points to mastering warehouse monitoring and optimizing query performance in Microsoft Fabric.
Fabric Capacities and the Warehouse
Why Monitoring Matters
Fabric Warehouse operates as a Software-as-a-Service (SaaS) solution, but that doesn’t mean it can be left to run without oversight. Effective monitoring is crucial to ensure optimal performance and resource utilization.
Relevant Workloads
- Dimensional Design: Ensuring proper design to optimize performance.
- No Trickle Inserts: Avoiding small, frequent inserts that can degrade performance.
- Optimizer Assistance: Creating unique and foreign keys to help the optimizer.
- Statistics Analysis: Regularly analyzing statistics to maintain query performance.
- Direct Lake: Understanding limits and fallback to DirectQuery.
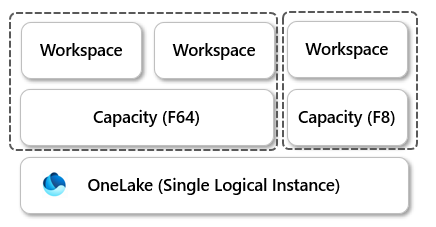
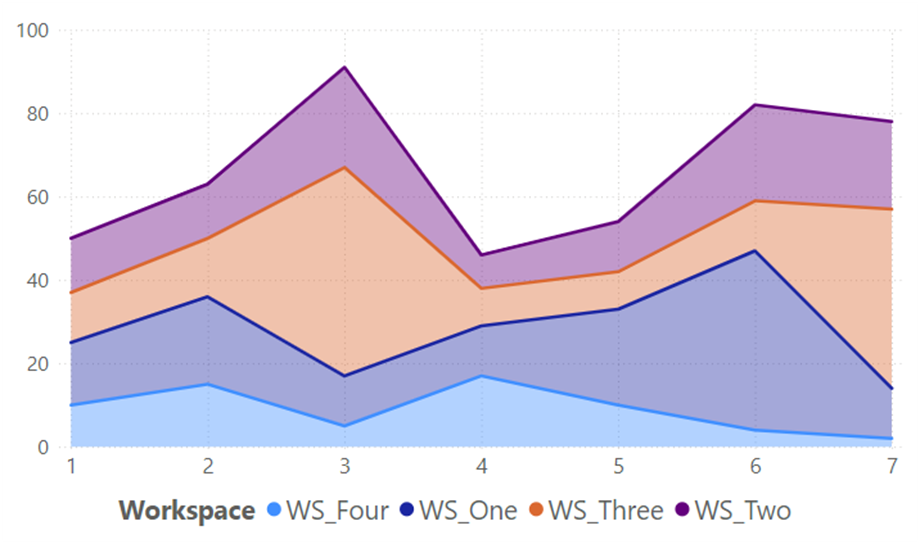
Fabric Capacities are Shared
Fabric capacities are shared across workspaces, meaning multiple workspaces can utilize a single capacity. This shared capacity model requires monitoring to ensure no one Fabric workload is causing an imbalance and hogging all the capacity resource.
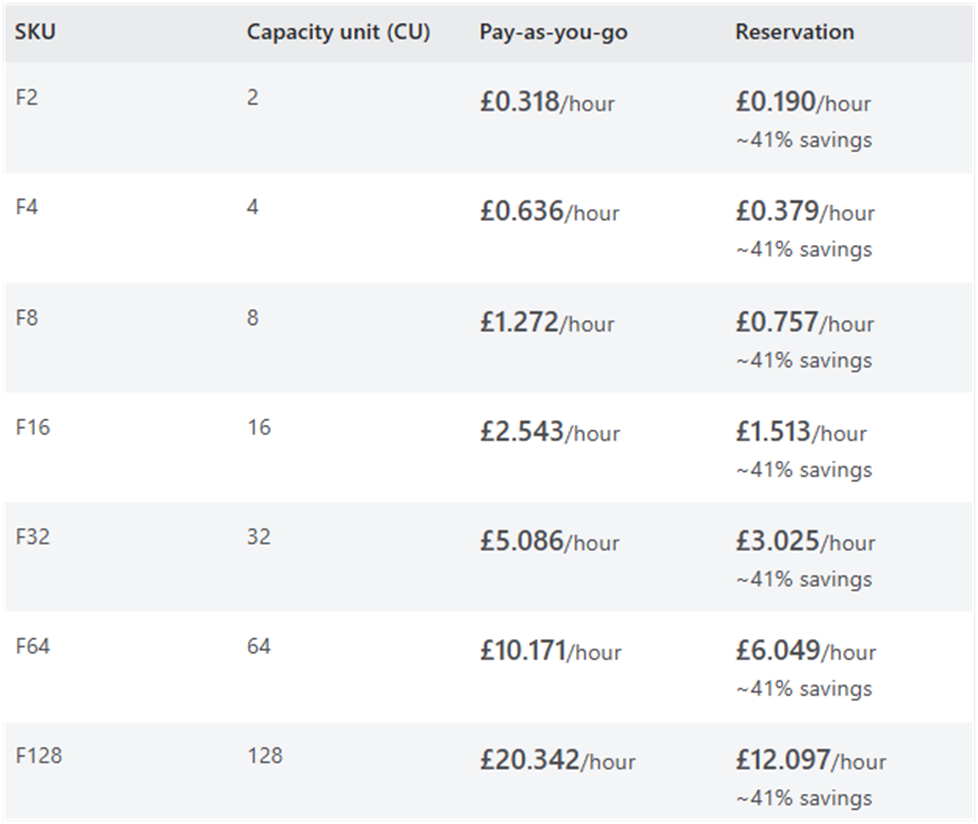
Fabric Capacity Units and Purchasing Capacity
Pay As You Go (PAYG)
- Flexible Option: Allows for pausing and resuming to control compute charges.
- Discounts: Offers a 40% discount on PAYG pricing.
- Usage: 2 Capacity Units (CUs) equal 1 vCore for the warehouse.
Reserved Pricing
- Cost Efficiency: Reserved pricing can offer significant savings over PAYG.
Capacity Consumption Monitoring
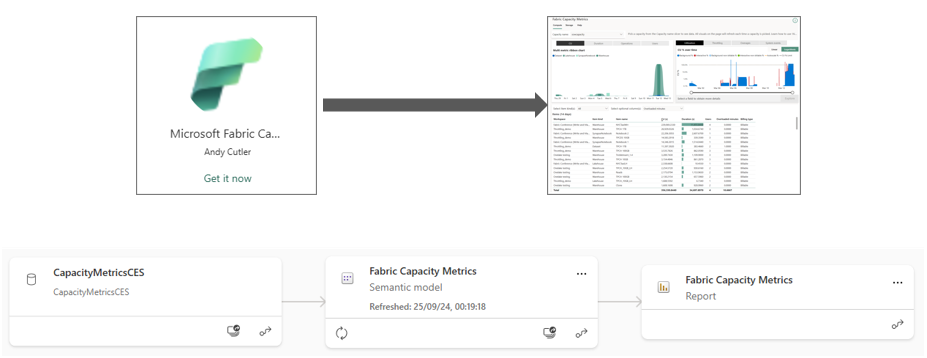
Fabric Capacity Metrics App
Microsoft provides an “out of the box” app for monitoring compute activity on Fabric and Power BI Premium capacities. This app installs a report and a semantic model into a new workspace, allowing users to filter for specific workloads and drill into timepoint details to identify potential issues.
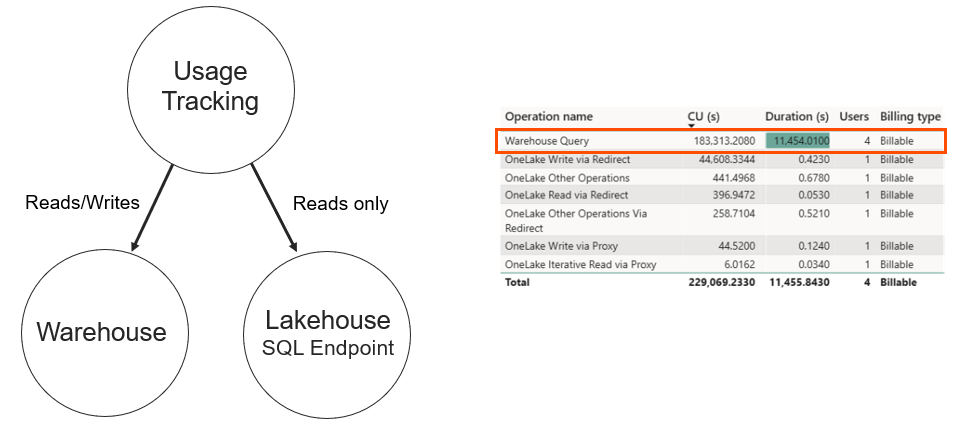
Warehouse Utilization
Compute Charges
Compute charges include both user and system activities. Monitoring reads and writes for data stored in OneLake is essential, as both warehouse and SQL endpoint activities are tracked.
Capacity Bursting & Smoothing
Bursting
Bursting is the technical process whereby your capacity will temporarily be allocated more compute to complete workloads faster or stop from failing. Workloads that run at specific times can benefit from bursting, rather than you over-provisioning capacity. Compute spikes generated by bursting will be automatically handled by smoothing
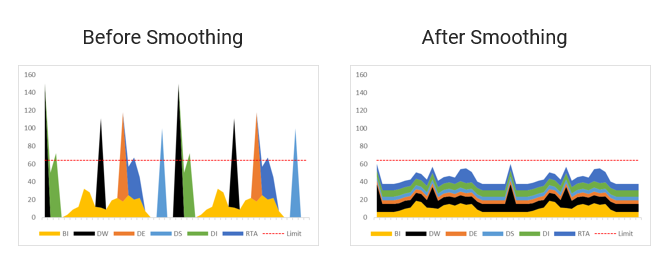
Smoothing
Smoothing is the process of “paying back” bursted capacity during future quiet periods. This ensures that workloads running at specific times benefit from bursting without over-provisioning capacity.
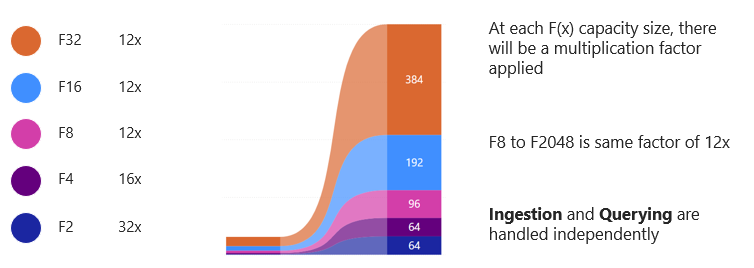
Guardrails
Bursting is not unlimited; there are guardrails in place to ensure reasonable constraints. Each capacity size has a multiplication factor applied, ensuring balanced resource allocation.
Throttling
Throttling Policies
Throttling applies when a capacity exceeds allowed purchased compute after smoothing. There are four throttling policies, ranging from overage protection to background rejection, each with specific impacts on user experience.
| Future Smoothed Consumption – Policy Limits | Throttling Policy | Experience Impact |
| Usage <= 10 minutes | Overage protection | Jobs can consume 10 minutes of future capacity use without throttling. |
| 10 minutes < Usage <=60 minutes | Interactive Delay | User-requested interactive jobs are delayed 20 seconds at submission. |
| 60 minutes < Usage <= 24 hours | Interactive Rejection | User requested interactive type jobs are rejected. |
| Usage > 24 hours | Background Rejection | All new jobs are rejected from execution. |
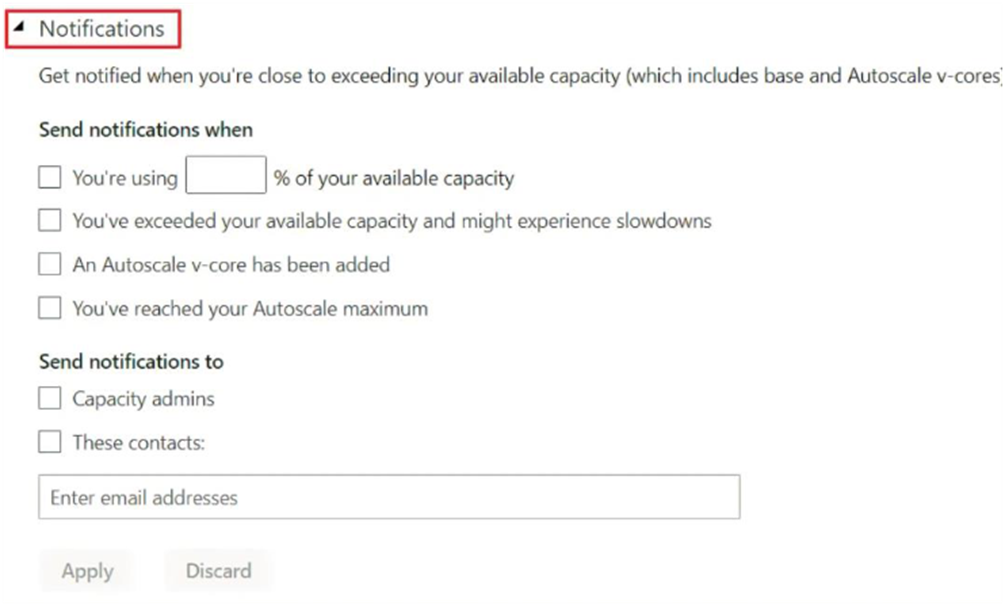
Throttling Alerts
Capacity admins can configure alerts in the Fabric Admin portal to notify them before capacity gets overloaded. This approach helps prevent performance degradation. In the Fabric Admin portal, configure alerts when certain % of capacity is used or exceeded.
Throttling Advice
- Wait for throttling state to finish before issuing new workload requests…
- Restart Capacity, this clears throttling but charges are added to your Azure bill!
- Find out which workloads are causing persistent issues and refactor if necessary
Cost Control and Monitoring
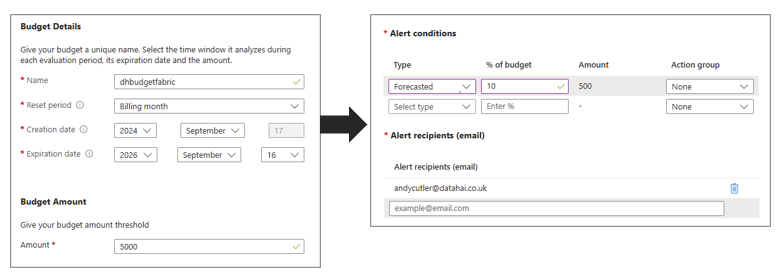
Creating budgets and cost alerts in Azure is recommended to manage Fabric capacities effectively. Setting actual or forecasted alerts helps in maintaining control over expenses.
References
- Microsoft Fabric concepts – Microsoft Fabric | Microsoft Learn
- Save costs with Microsoft Fabric Capacity reservations – Microsoft Cost Management | Microsoft Learn
- What is the Microsoft Fabric Capacity Metrics app? – Microsoft Fabric | Microsoft Learn
- Understand your Fabric capacity throttling – Microsoft Fabric | Microsoft Learn