Fabric Warehouse Monitoring with Dynamic Management Views (DMVs)
Overview
Monitoring warehouse queries is crucial for maintaining the efficiency and performance of SQL Analytics Endpoints and Warehouses. This blog post explores the use of Dynamic Management Views (DMVs) to monitor connection, session, and request status, troubleshoot SQL queries, and analyze historical query performance.
Dynamic Management Views (DMVs)
Monitoring Connections, Sessions, and Requests
DMVs provide valuable insights into the status of connections, sessions, and requests within SQL Analytics Endpoints and Warehouses. These system DMVs include:
- sys.dm_exec_connections: Provides details about active connections to the Fabric Warehouse SQL Engine, including session ID, client address, client port, protocol, and authentication method.
- sys.dm_exec_sessions: Offers information on resource utilization by each session, such as the number of active requests and currently executing or waiting queries. It includes details like session ID, query text, start time, and status.
- sys.dm_exec_requests: Displays information about active user connections and resource utilization by each session.
User Permissions
Different user roles have varying levels of access to DMVs:
- Member, Contributor, and Viewer: Can execute
sys.dm_exec_sessionsandsys.dm_exec_requests. - Workspace Admin: Has access to all DMVs and can issue the KILL command to terminate long-running queries.
Historical Queries: Query Insights
New DMVs for Fabric Warehouse
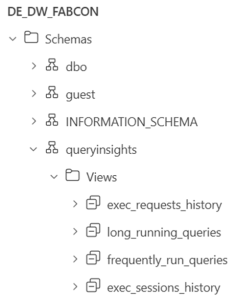
When provisioning a Fabric Warehouse, a schema is automatically created called queryinsights. There are 4 Views (DMVs) within this schema that hold useful information about SQL queries being executed on the Warehouse. Each view has the actual SQL command being run. These DMVs are useful for:
- Which T-SQL statements are succeeding, failing, or being canceled?
- What are the row counts for workloads?
- How long are these workloads running?
- Which queries are degrading in performance over time?
DMVs
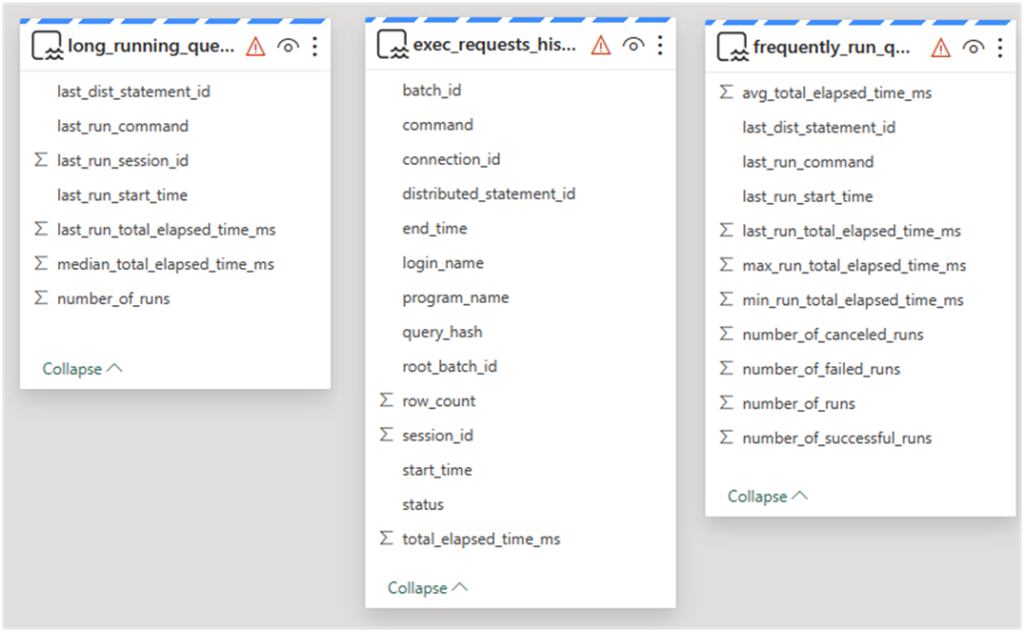
- exec_requests_history: Provides granular information about each completed query, including status, row counts, and elapsed time.
- long_running_queries: Aggregates data to show the median execution time versus the last run time of queries, along with statistics like average, minimum, and maximum execution times.
- frequently_run_queries: Displays the number of runs for queries and their execution times.
- exec_sessions_history: Shows the history of sessions, including session status, who ran the command, start and end times.
Data Retention
Query Insights data is retained for 30 days, with the option to archive the data to a Warehouse table using T-SQL.
Semantic Model Reporting
Integrating Query Insights
Query Insights can be made visible in the semantic model by adding these views to the default dataset. This allows for the creation of visuals to quickly show important metrics and surface them in a report. The DMVs can be joined using the distributed_statement_id.
Conclusion
Dynamic Management Views (DMVs) are powerful tools for monitoring and troubleshooting SQL queries in Fabric Warehouses. By leveraging these views, users can gain valuable insights into query performance, resource utilization, and historical query data, ultimately improving the efficiency and effectiveness of their warehouse operations.