Performance Analysis of V-Ordering in Fabric Warehouse: On or Off?
Overview
V-Order is Microsoft’s “special sauce” to further optimise data within Parquet files and is a read optimiser feature. V-Order also helps optimise Power BI DirectLake functionality. However, V-Order comes with an overhead when writing and can be deactivated/activated on a table in a Lakehouse. Now in Fabric Warehouse we can disable V-Ordering, however this is on the whole Warehouse. We can’t choose which tables, plus it can’t be reversed so once you switch if off in a Warehouse, that’s it.
- Delta Lake table optimization and V-Order – Microsoft Fabric | Microsoft Learn
- Understand V-Order – Microsoft Fabric | Microsoft Learn
- Disable V-Order in Warehouse – Microsoft Fabric | Microsoft Learn
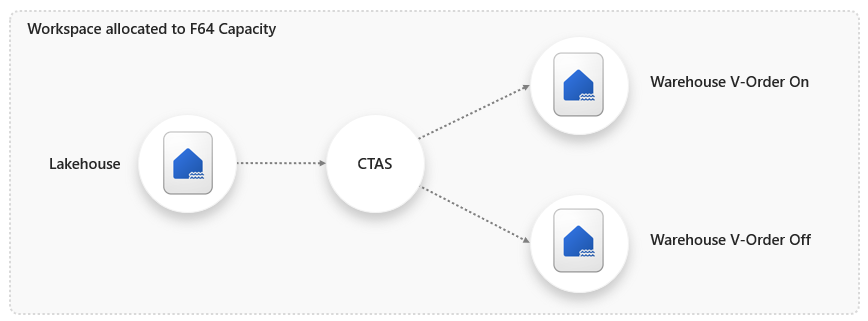
I want to test the speed and capacity unit usage when loading a table when V-Order is on and off. The process for this test is to create 2 Warehouses, with one Warehouse V-Order deactivated and the other with V-Order activated (the default). I’ll then use a CTAS (CREATE TABLE AS SELECT) statement in each Warehouse to load 1.1billion rows from a Lakehouse table. All of these items are in the same workspace and this workspace is allocated to an F64 Fabric capacity.
Deactivating V-Order
When creating a Warehouse the default is V-Order is activated, we can deactivate and check by running the following SQL command in a Warehouse:
--deactivate V-Order
ALTER DATABASE CURRENT SET VORDER = OFF;

--check status
SELECT [name], [is_vorder_enabled]
FROM sys.databases;
Why Deactivate V-Order
Well, that’s the big question…why keep it enabled and why deactivate it? Well, it’s for read optimisation and enables DirectLake in semantic models, therefore we want to have V-Order enabled in whatever data store is close to our business reporting. But, if read performance isn’t that important and if the overhead of writing to V-Order enabled tables is greater than the benefit, then perhaps deactivating may be in the best interest of both speed and capacity unit usage. Use cases have included transient “staging” data that is moving through a data loading process, why optimise for reading if it’s just being landed to be moved on somewhere else?
SQL Workloads
For the testing I’ll be running the following on each Warehouse. The CREATE TABLE AS SELECT (CTAS) query uses a 3 part naming convention to query the Lakehouse table in the same workspace.
--CTAS query
CREATE TABLE dbo.stgWebTelemetry
AS
SELECT
    UserID,
    EventType,
    ProductKey,
    URL,
    Device,
    SessionViewSeconds,
    EventYear,
    EventMonth,
    EventDate
FROM LakehouseOne.dbo.raw_webtelemetry;
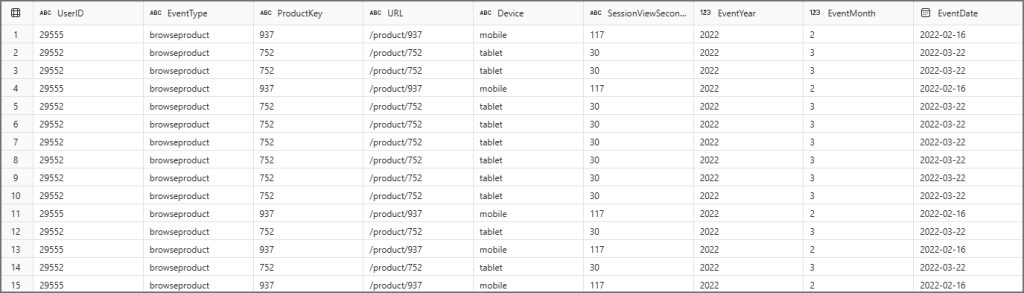
The dataset I’ll be using is my standard test data set of synthetic web telemetry data. If you’d like to use data for your own testing, check out my GitHub which has a SQL script to load a Warehouse with example data from Microsoft.
Duration of Writing
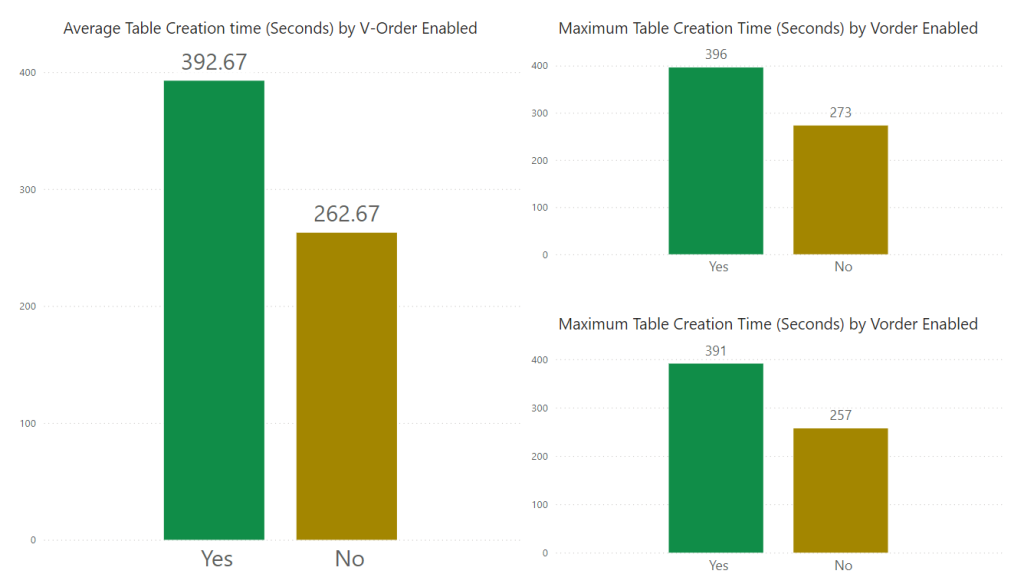
Let’s look at how long it takes to create and write a table, I’ll use a CTAS statement to create and load a table from a Lakehouse to a Warehouse. I ran the load 3 times and created an average plus minimum and maximum load times, there wasn’t a huge difference across the 3 load times,
Looking at the results, it shows that when V-Order is activated, the load is on average 50% slower to run than when its deactivated.
Duration of Reading
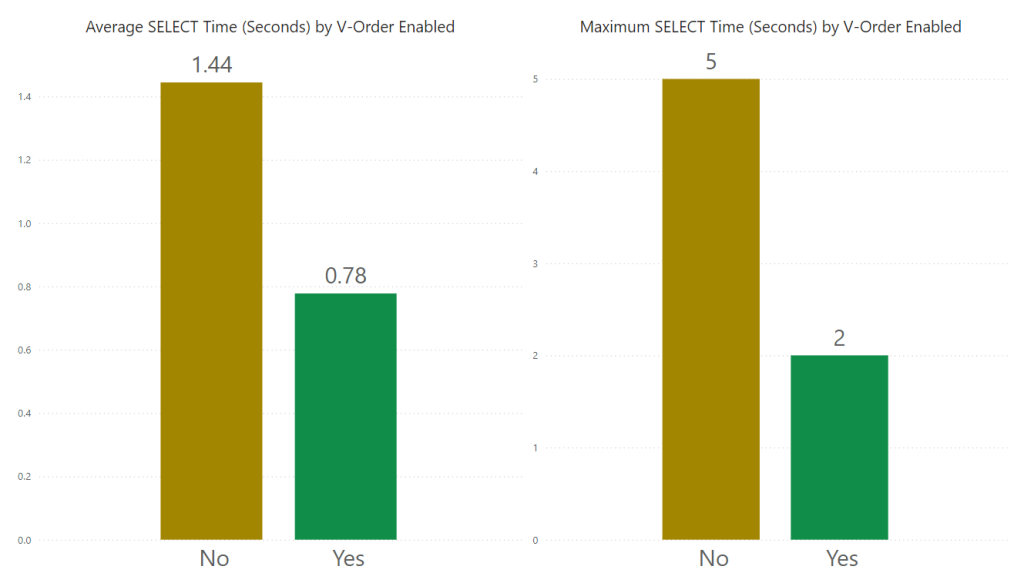
However, on the flip side it’s slower to read the table, with the average being twice as long to read. I ran 3 different SQL GROUP BY queries (see References in this blog), each query added more columns into the SELECT. I haven’t included a minimum graph as all queries generated a 0 minimum due to caching.
Capacity Units (CU) Usage when Writing
Time isn’t the only metric I’m interested in, I’d like to know how many capacity units are consumed when running the load query. Ideally we’d like all our workloads to consume as few of those precious capacity units as possible because that means we can run workloads at a lower compute (or more workloads). In order to get the capacity units used per query:
- In each Warehouse: SELECT distributed_statement_id FROM queryinsights.exec_requests_history WHERE command LIKE ‘%CREATE TABLE%’
- Open the Fabric Capacity Metrics App, drill down into timepoint detail and expose the operationId column in the Background chart.
- Filter the visual using the operationId column and use the value from the distributed_statement_id from the queryinsights view.
- Note the Total CU(s) column
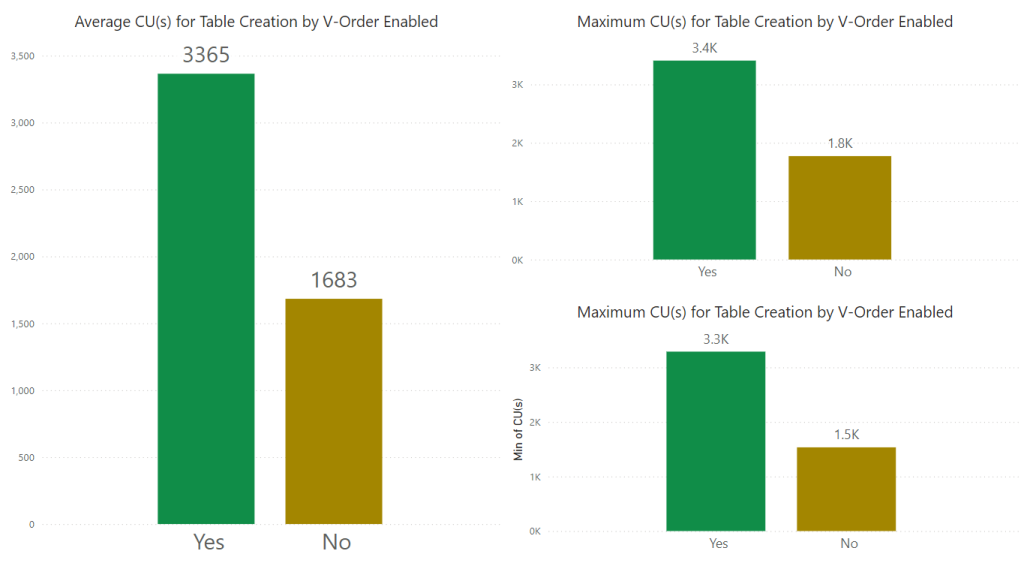
In the results below we can see that on average when writing to the new table when V-Order is on uses twice as many CUs than when off. Minimum and Maximum values don’t vary that much. I actually ran these tests over and over again on a couple of different dataset sizes (10GB and 50GB), both with 1.1B rows and observed similar trends.
Capacity Units (CU) Usage when Reading
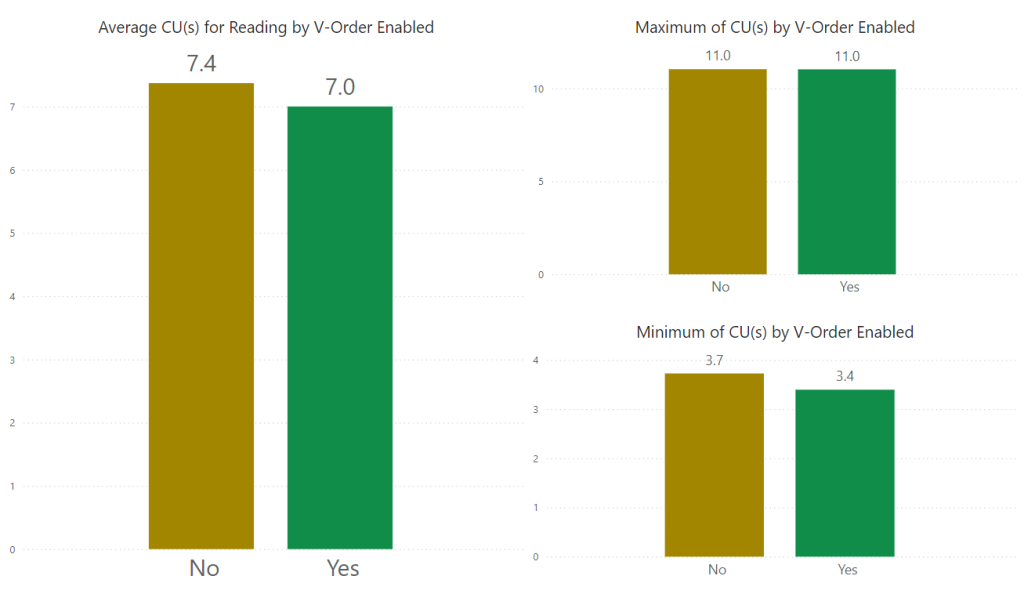
As V-Ordering is a read optimisation process, we need to see the impact when selecting from the table. What we save when writing data may not actually benefit us if reading the data becomes slow and CU usage becomes high. In my dataset testing, I didn’t see a huge jump in CU usage when reading the data.
Conclusion
We can see that when deactivating V-Order, speeds and capacity units usage decrease when writing data, when reading data speeds are slower but CU usage remains roughly the same.
So should you switch it off in a Warehouse? It depends! If it’s more beneficial for a Warehouse to have V-Order deactivated because read is less important than write, then go for it. Your mileage may vary, but I’m wondering why you’d want to switch off V-Order in a Warehouse…would you use a Warehouse for staging data? Perhaps…but to my mind and in reference to all the architecture patterns out there, the Warehouse is usually for the gold/presentation layer, so read would be important.
References
- Delta Lake table optimization and V-Order – Microsoft Fabric | Microsoft Learn
- Understand V-Order – Microsoft Fabric | Microsoft Learn
- Disable V-Order in Warehouse – Microsoft Fabric | Microsoft Learn
SQL SELECTs
--query 1
SELECT
    EventType,
    COUNT(*)
FROM FactWebTelemetry_NoVOrder
GROUP BY
    EventType

--query 2
SELECT
    EventType,
    ProductKey,
    COUNT(*)
FROM FactWebTelemetry_NoVOrder
GROUP BY
    EventType,
    ProductKey;

--query 3
SELECT
    EventType,
    ProductKey,
    Device,
    COUNT(*)
FROM FactWebTelemetry_NoVOrder
GROUP BY
    EventType,
    ProductKey,
    Device;